This demo is still under development... The assignement is incorrect to faciliate tests of different features.
J-graph output
For each multiplet, the coupling constants are represented with colored dots or blocks at a height proportional their values.
When the coupling are assigned, horizontal lines connect the coupling partners.
Unassigned coupling constants are represented with larger colored dots. When the rolling over them, the candidate partners are highlighted. When only one is found the ruler (dotted horizontal line) is green, indicating that the two spins could be paired.
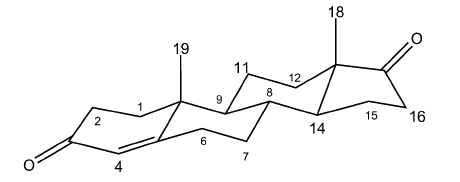
The coupling network of androsten was used as an example. The geminal coupling constants were set to negative values. Coupling constants based on DFT/GIAO are also available. A few coupling partners were disconnected to show how J-graph can be used to assign couplings.
Note that enlargement are obtained by brushing the spectrum. A double-click restores the full display.
More information on the color code.
This page is a demo. The visualisation uses the D3 library and a crude javascript code controls the user interactions. The input data of this demo were produced using a simple data generator written in C++). The possibility to read the NMReDATA file directly and determining the line paths in the javascript code is necessary before it can be applied to other cases easily.
A visualization of the chemical structure highlighting the selected protons would be very useful and should be easy to implement.